photo credit: UN Biodiversity
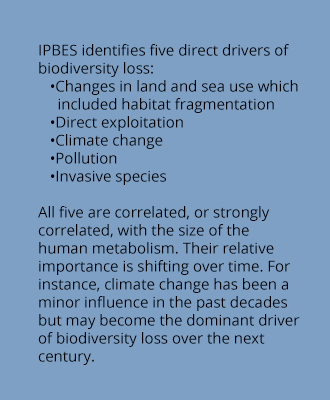
 All five mechanisms that drive down biodiversity are symptoms of ecological overshoot (see also the adjacent blue box). Overshoot is caused by the human economy’s demand for more resources from nature than nature can regenerate.
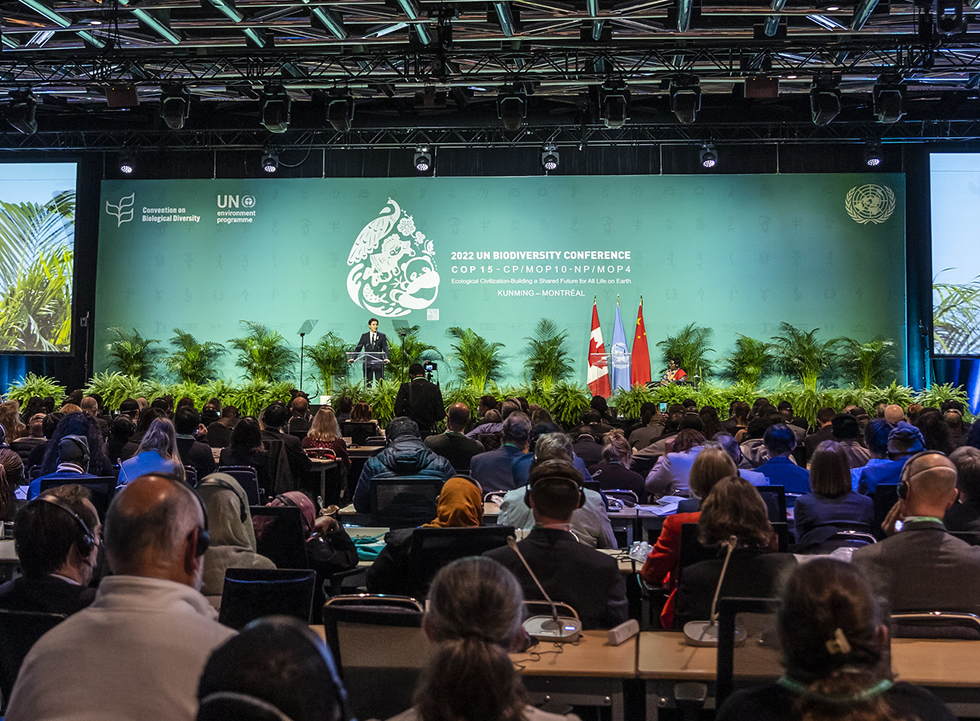
This insight was core to a proposal for the UN Biodiversity Conference COP 15. Several countries proposed and supported the call for “halving the footprint of production and consumption by 2030”. The reason is simple: If we are to halt the loss of biodiversity and maintain healthy ecosystems while also creating a resilient economy, ending overshoot is necessary. Unfortunately, the political momentum at the conference was not sufficient to explicitly recognize overshoot in the approved version of the framework. So this proposal did not make it as explicitly into the final texts of the UN Biodiversity Conference COP 15 that concluded on December 19, 2022 in Montreal.
Still, the final version of the conference’s Kunming-Montreal Global Biodiversity Framework endorses much of what Ecological Footprint assessments have made obvious. In “Global Targets”, the framework asks countries to “reduce the global footprint of consumption in an equitable manner [by 2030], including through halving global food waste, significantly reducing overconsumption and substantially reducing waste generation, in order for all people to live well in harmony with Mother Earth” (page 11: Target 16). While falling short of acknowledging overshoot, it does recognize the need to reduce humanity’s demand on nature. We were also delighted to see Global Footprint Network’s original call for “all to live well, within the means of our planet” reflected in that statement.
Possibly even more significant is the “monitoring framework” for the Kunming-Montreal Global Biodiversity Framework. It matters because it is designed to help scrutinize the agreement’s implementation. In this monitoring framework, the Ecological Footprint is notably mentioned as:
- a complementary indicator for Target 15 (together with “Species threat abatement and restoration metric” and “Number of companies publishing sustainability reports”);
- a component indicator for Target 16 (together with “Food waste Index”, “Material footprint per capita”, “Global environmental impacts of consumption”); and
- a complementary indicator for a portion of Goal B, namely “B.1 Services provided by ecosystems”.
This is promising, particularly given Ecological Footprint accounting’s focus on the key outcome that ecosystems provide: regeneration. The National Footprint and Biocapacity Accounts track what ecosystems can regenerate compared to how much people demand. This comparison enables us to monitor whether humanity lives well and in harmony with Mother Earth.
The Accounts are both relevant and robust. They build on a 30-year academic history with hundreds of peer reviewed papers. In the public sector, they’ve been tested in over a dozen government reviews. The first large scale comparison of country Footprints was launched in 1997 (and academically published in 1999). Over the years, the accounts have produced dependable, consistent results, and have continuously improved as better data becomes available. The latest National Footprint and Biocapacity Accounts edition was published in 2022 by York University and FoDaFo.
For more on biodiversity and Footprint assessments, visit our biodiversity page.


